No results
Frequent Searches
"Axle"
"Tires"
"Setup"
"Caster"
"Seat"
"Carburetion"
"Carburettor"
Frequent Searches
 Exclusive Content

In the previous article on telemetry, we focussed on the detailed analysis of a lap by comparing the fastest time of two drivers and looking at the driving style on each bend to try to find where one gained time over the other. This work is undoubtedly useful, but it takes a long time to analyse all the data and provide feedback to the driver to help them improve. Basically, it is a typical task that is done without hurry at the end of a session. However, often there is also a need to analyse data during a session, when there is little time available. In this case, it is necessary to use a small set of data that, nevertheless, allows a good analyst to form a comprehensive picture of the overall situation and understand what needs work in order to improve there and then.
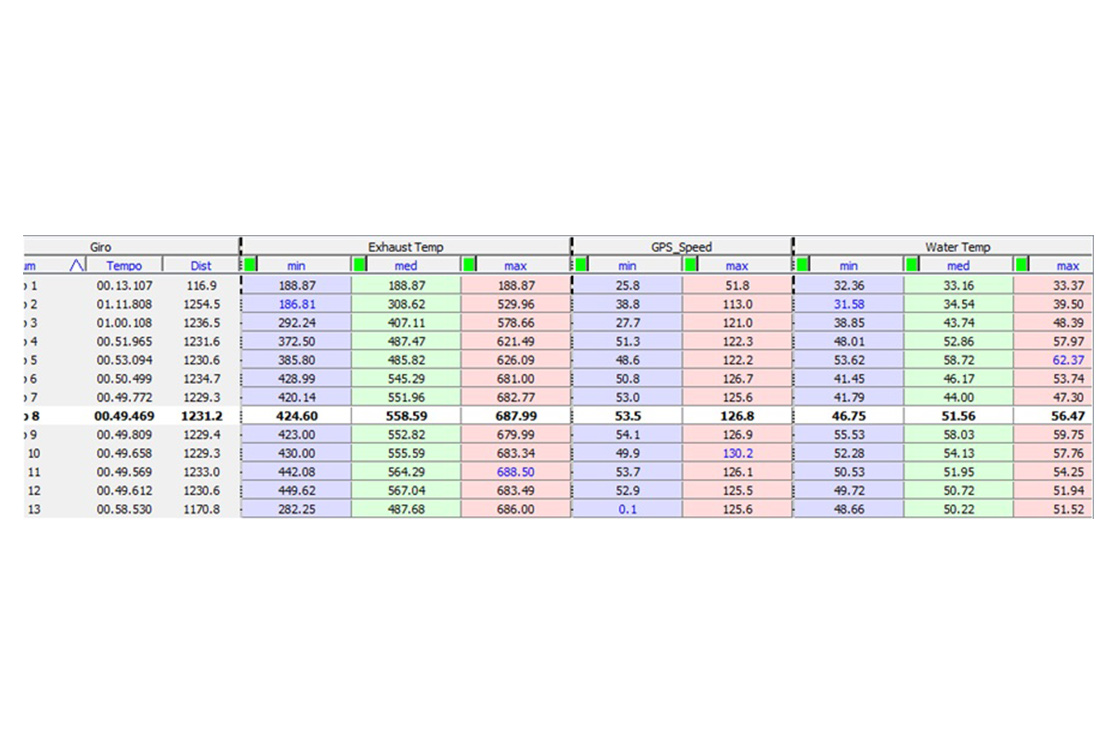
When you are out on the track, the first thing you need to do as soon as the driver comes back into the pits and the data is downloaded is to have a table ready with the significant data of the session that has just ended. It’s not only the data relating to the lap times, but also the way in which the kart functioned so that you have everything you need to check any problems and intervene in good time. If you use analytical software such as AIM, for example, it is easy to create that sort of table on which to enter, lap by lap, the parameters needed to understand engine performance, such as exhaust gas temperature and water temperature. It's always important to take a glance right away to understand if there are problems with carburetion or cooling.
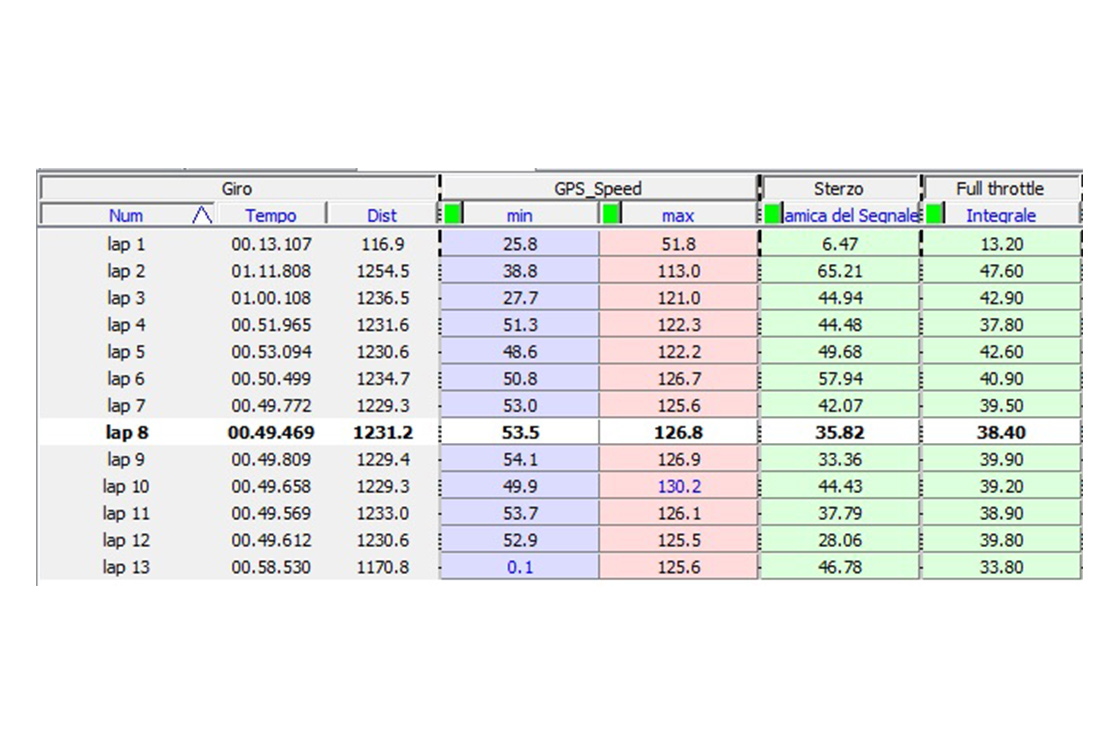
A table like the previous one helps us a lot in this case, too. The first data to look at is undoubtedly the lap time: at the end of the day, that is the most important thing in establishing the level of performance. Where speed is concerned, as well as maximum velocity, minimum velocity is also important, because it allows us to understand whether, compared to a previous lap, we were able to take the slowest bend on the track at a higher speed.
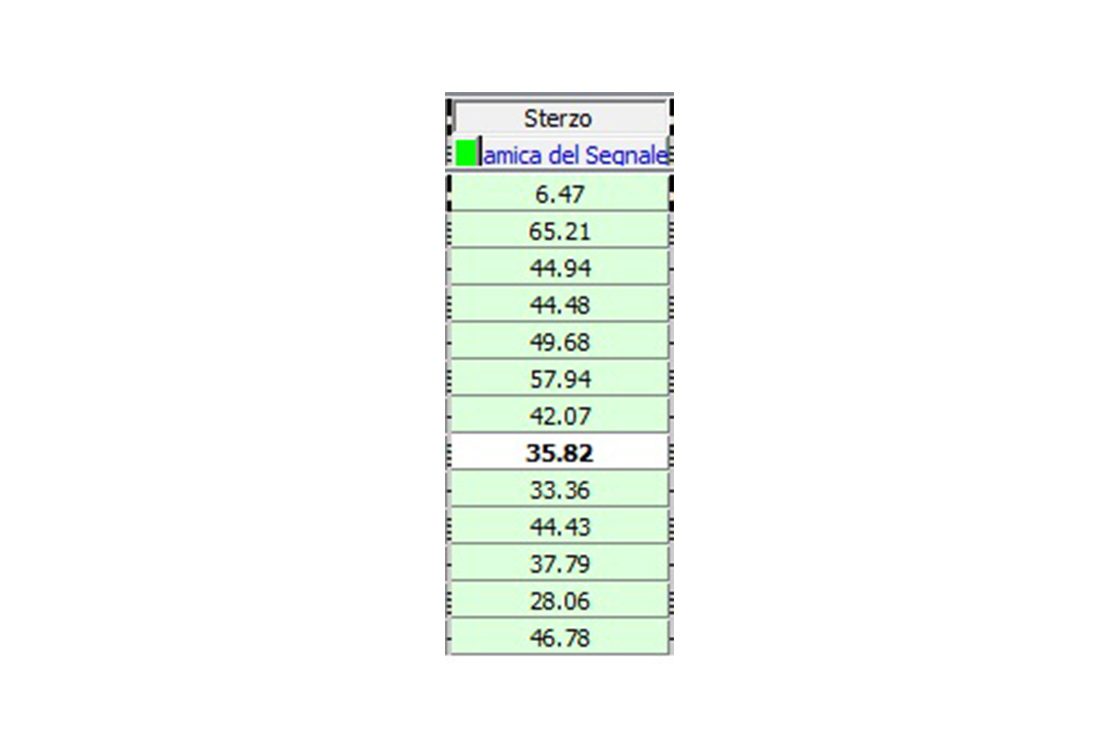
Steering data (see the column in the table to the side) is a little less immediately understandable for non-experts: the AIM software records what is called "signal dynamics", indicating how much a signal deviates from an average value. The higher the value, the more the signal is "loud". When it comes to steering, it means greater use and, therefore, more corrections by the driver when driving.
Lastly, accelerator data tells us how many seconds a driver manages to keep the accelerator pressed over 95% during a lap: obviously, the higher the number, the better.